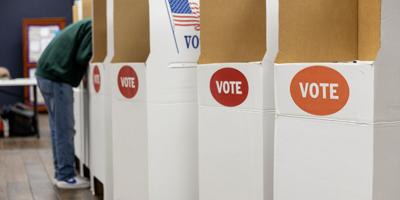

On Tuesday, voters in Norman cast their ballots in the city's latest municipal election. Data from the past seven mayoral elections show changes in Norman’s voter turnout and voting patterns.
• Voter turnout in the 2025 mayoral election remained high: Data from 2025 showed 18,452 people voted, 27.7% fewer than in 2022 when 24,393 people cast ballots, but 34.1% more than the turnout in 2019 when 13,068 voted. Defeated incumbent Mayor Larry Heikkila garnered 50.37% fewer votes in 2025 than he did in 2022 when he was elected.
• In 2025, east Norman precincts voted for Holman: Nearly all precincts in core Norman and Ward 5 went to the council member. In 2022, Ward 5 primarily voted for Heikkila. This election, the bulk of Ward 5 voters cast their ballots for Holman. Across town in Ward 3, Heikkila kept most precincts north of Main Street.
• Voter turnout in the 2022 mayoral election skyrocketed: Data from 2007-19 showed an average voter turnout of about 12,327 voters, while the 2022 election drew over 24,000 voters to the polls, the highest mayoral turnout in 15 years.
• Voter turnout dropped during the 2010, 2013 and 2016 elections: Voter turnout dropped for three consecutive elections, with the 2016 race between former Mayor Lynne Miller, Gary Barksdale and Bobby Stevens drawing just 9,970 voters.
• In 2022, core Norman voted differently than the rest of the city: In the race between incumbent Mayor Breea Clark and Larry Heikkila, core Norman voted for Clark while the rest of Norman — with the exception of a precinct in far north Ward 3 — voted for Heikkila.
• All past elections have been primarily between two candidates: in races with three candidates, the lesser-known candidate has not materially impacted the race. The highest amount of votes for a third candidate occurred in 2013 when David Kempf received 929 of the 10,886 votes cast. That held true again in 2025, as Riley Mulinix received 712 of the 18,452 votes cast.
OU Daily has created graphics displaying this data for readers to dive into, precinct by precinct, to explore how prior mayors won their races. See the graphs and interactive map below.
Graphic by OU's Center for Spatial Analysis (Special thanks to Todd Fagin and Jacob Tillotson).


